One of the most common concerns I hear from people is how to think about market declines, especially as they get closer to retirement or begin drawing from their savings.
It’s a reasonable concern. Market volatility can feel unsettling, even when you know it’s part of investing.
The challenge isn’t just understanding that markets move. It’s thinking through how to respond when they do..
Volatility Is Normal, Even When It Doesn’t Feel Like It
Markets don’t move in straight lines. Periods of decline are a natural part of long-term investing.
The difficulty is that when volatility shows up, it rarely feels normal in the moment. It can feel like something has changed or that action needs to be taken.
Historically, markets have moved through cycles of growth and decline.
The Real Risk Is Often Behavioral
For long-term investors, one of the most significant risks isn’t volatility itself. It’s how we react to it.
Selling during a downturn or making significant changes based on short-term market movements can disrupt a plan that was designed for much longer time horizons.
That doesn’t mean you ignore what’s happening. It means your response should be grounded in your plan, not in the moment.
Your Time Horizon Still Matters
One of the most important factors during periods of volatility is your time horizon.
If your goals are years or decades away, sare often less relevant to long-term planning than they may feel at the time.
Even in retirement, many plans are designed to last for decades. That longer horizon still matters when thinking about how to respond to market changes.
A Plan Provides Context
Market declines can feel very different depending on whether you have a plan in place.
Without a plan, it’s easy to focus on account values and day-to-day movements.
With a plan, you can step back and ask more important questions:
Has anything actually changed about my long-term goals?
Do I need to adjust anything, or stay the course?
How does this fit into the bigger picture?
In some cases, the answer may be that nothing meaningful has changed.
Staying invested doesn’t mean ignoring risk or avoiding adjustments altogether.
It means making decisions thoughtfully, based on your overall plan rather than reacting to short-term uncertainty.
Diversification helps manage risk, though it does not eliminate it. Maintaining an allocation aligned with your plan continues to play an important role over time.
If you want a deeper look at how investments connect to income in retirement, you can read more here: Planning for Retirement Income.
Bringing It Together
Market volatility is part of investing. It always has been, and it likely always will be.
The goal is not to avoid it, but to be prepared for it.
A thoughtful plan, combined with a long-term perspective, can help you stay focused on what matters and avoid decisions that may not align with your long-term plan.
If You’d Like Help Thinking This Through
If you are approaching retirement or already retired and want help thinking through how your plan responds during periods of market volatility, you can schedule a brief, complimentary call.
No pressure. Just a chance to see if it makes sense to talk further.
Look beyond this moment and stay focused on your long-term objectives.
Volatility will always be around on Wall Street, and as you invest for the long term, you must learn to tolerate it. Rocky moments, fortunately, are not the norm.
Since the end of World War II, there have been dozens of Wall Street shocks.
Wall Street has seen 56 pullbacks (retreats of 5-9.99%) in the past 73 years; the S&P index dipped 6.9% in this last one. On average, the benchmark fully rebounded from these pullbacks within two months. The S&P has also seen 22 corrections (descents of 10-19.99%) and 12 bear markets (falls of 20% or more) in the post-WWII era. (1)
Even with all those setbacks, the S&P has grown exponentially larger. During the month World War II ended (September 1945), its closing price hovered around 16. At this writing, it is above 2,750. Those two numbers communicate the value of staying invested for the long run. (2)
This current bull market has witnessed five corrections, and nearly a sixth (a 9.8% pullback in 2011, a year that also saw a 19.4% correction). It has risen roughly 335% since its beginning even with those stumbles. Investors who stayed in equities through those downturns watched the major indices soar to all-time highs. (1)
As all this history shows, waiting out the shocks may be highly worthwhile.
The alternative is trying to time the market. That can be a fool’s errand. To succeed at market timing, investors have to be right twice, which is a tall order. Instead of selling in response to paper losses, perhaps they should respond to the fear of missing out on great gains during a recovery and hang on through the choppiness.
After all, volatility creates buying opportunities. Shares of quality companies are suddenly available at a discount. Investors effectively pay a lower average cost per share to obtain them.
Bad market days shock us because they are uncommon.
If pullbacks or corrections occurred regularly, they would discourage many of us from investing in equities; we would look elsewhere to try and build wealth. A decade ago, in the middle of the terrible 2007-09 bear market, some investors convinced themselves that bad days were becoming the new normal. History proved them wrong.
As you ride out this current outbreak of volatility, keep two things in mind.
One, your time horizon. You are investing for goals that may be five, ten, twenty, or thirty years in the future. One bad market week, month, or year is but a blip on that timeline and is unlikely to have a severe impact on your long-run asset accumulation strategy. Two, remember that there have been more good days on Wall Street than bad ones. The S&P 500 rose in 53.7% of its trading sessions during the years 1950-2017, and it advanced in 68 of the 92 years ending in 2017. (3,4)
Sudden volatility should not lead you to exit the market.
If you react anxiously and move out of equities in response to short-term downturns, you may impede your progress toward your long-term goals.
▲ Time, diversification and the volatility of returns
This chart shows historical returns by holding period for stocks, bonds and a 50/50 portfolio, rebalanced annually, over different time horizons. The bars show the highest and lowest return that you could have gotten during each of the time periods (1-year, 5-year rolling, 10-year rolling and 20-year rolling). This page advocates for simple balanced portfolio, as well as for having an appropriate time horizon.
This material was prepared by MarketingPro, Inc., and does not necessarily represent the views of the presenting party, nor their affiliates. This information has been derived from sources believed to be accurate. Please note – investing involves risk, and past performance is no guarantee of future results. The publisher is not engaged in rendering legal, accounting or other professional services. If assistance is needed, the reader is advised to engage the services of a competent professional. This information should not be construed as investment, tax or legal advice and may not be relied on for avoiding any Federal tax penalty. This is neither a solicitation nor recommendation to purchase or sell any investment or insurance product or service, and should not be relied upon as such. All indices are unmanaged and are not illustrative of any particular investment.
In August of 2020, the Fed announced that it is willing to allow inflation to run higher than normal in order to support the labor market and broader economy. This major policy shift allows inflation to run above the Fed’s 2% goal for some time before the Fed would consider increasing short-term interest rates in an attempt to combat higher prices. (1)
These robust changes to the Fed’s long-standing inflation policy further illustrates the importance of understanding how inflation is reported and how it can affect your investments.
What Is Inflation?
Inflation is defined as an upward movement in the average level of prices. Each month, the Bureau of Labor Statistics releases a report called the Consumer Price Index (CPI) to track these fluctuations. It was developed from detailed expenditure information provided by families and individuals on purchases made in the following categories: food and beverages, housing, apparel, transportation, medical care, recreation, education and communication, and other groups and services. (2)
How Applicable Is the CPI?
While it’s the commonly used indicator of inflation, the CPI has come under scrutiny. For example, the CPI rose 1.4 percent for the 12-months ending in January 2021 – a relatively small increase. However, a closer look at the report shows movement in prices on a more detailed level. Used car and truck prices, for example, rose 10 percent during those 12 months. (3)
As Inflation Rises and Falls, Three Notable Effects are Observed:
First, inflation reduces the real rate of return on investments. So, if an investment earned 6 percent for a 12-month period, and inflation averaged 1.5 percent over that time, the investment’s real rate of return would have been 4.5 percent. If taxes are considered, the real rate of return may be reduced even further. (4)
Second, inflation puts purchasing power at risk. When prices rise, a fixed amount of money has the power to purchase fewer and fewer goods.
Third, inflation can influence the actions of the Federal Reserve. If the Fed wants to control inflation, it has various methods for reducing the amount of money in circulation. Hypothetically, a smaller supply of money would lead to less spending, which may lead to lower prices and lower inflation.
Empower Yourself with a Trusted Professional.
When inflation is low, it’s easy to overlook how rising prices are affecting a household budget. On the other hand, when inflation trends higher, it may be tempting to make more sweeping changes in response to increasing prices. The best approach may be to reach out to your financial professional to help you develop an investment strategy that takes both possible scenarios into account.
Average Inflation Targeting
This page shows inflation expectations and the headline personal consumption deflator over time. The Federal Reserve’s policy framework of average inflation targeting seeks to push up inflation expectations (left) and will allow for a period of inflation over their 2% target, indicating that they are more concerned about the prospect of too little inflation, rather than too much. (5)
This is a hypothetical example used for illustrative purposes only. It is not representative of any specific investment or combination of investments. Past performance does not guarantee future results.
This material was prepared by MarketingPro, Inc., and does not necessarily represent the views of the presenting party, nor their affiliates. This information has been derived from sources believed to be accurate. Please note – investing involves risk, and past performance is no guarantee of future results. The publisher is not engaged in rendering legal, accounting or other professional services. If assistance is needed, the reader is advised to engage the services of a competent professional. This information should not be construed as investment, tax or legal advice and may not be relied on for the purpose of avoiding any Federal tax penalty. This is neither a solicitation nor recommendation to purchase or sell any investment or insurance product or service, and should not be relied upon as such. All indices are unmanaged and are not illustrative of any particular investment.
Investors are routinely warned about allowing their emotions to influence their decisions. However, they are less routinely cautioned about their preconceptions and biases that may color their financial choices.
Examples of Biases
In a battle between the facts & biases, our biases may win. If we acknowledge this tendency, we may be able to avoid some unexamined choices when it comes to personal finance. It may actually “pay” to recognize blind spots and biases with investing. Here are some common examples of bias creeping into our financial lives.
1) Letting Emotions Run the Show
An investor thinks, “I got a great return from that decision,” instead of thinking, “that was a good decision because __.” (1)
How many investment decisions do we make that have a predictable outcome? Hardly any. In retrospect, it is all too easy to prize the gain from a decision over the wisdom of the decision, and to, therefore, believe that the findings with the best outcomes were the best decisions (not necessarily true). Putting some distance between your impulse to make a change and the action you want to take to help get some distance from your emotions. (1)
2) Valuing Facts We “Know” & “See” More Than “Abstract” Facts
Information that seems abstract may seem less valid or valuable than information that relates to personal experience. This is true when we consider different types of investments, the state of the markets, and the economy’s health. (2)
3) Valuing the Latest Information Most
In the investment world, the latest news is often more valuable than old news. But when the latest news is consistently good (or consistently bad), memories of previous market climate(s) may become too distant. If we are not careful, our minds may subconsciously dismiss the eventual emergence of the next bear (or bull) market. (2)
4) Being Overconfident
The more experienced we are at investing, the more confidence we have about our investment choices. When the market is going up, and a clear majority of our investment choices work out well, this reinforces our confidence, sometimes to a point where we may start to feel we can do little wrong, thanks to the state of the market, our investing acumen, or both. This can be dangerous. (3)
5) The Herd Mentality
You know how this goes: if everyone is doing something, they must be doing it for sound and logical reasons. The herd mentality is what leads many investors to buy high (and sell low). It can also promote panic selling. The advent of social media hasn’t helped with this idea. Above all, it encourages market timing, and when investors try to time the market, they frequently realize subpar returns. (4)
Sometimes, asking ourselves what our certainty is based on and reflecting about ourselves can be a helpful and informative step. Examining our preconceptions may help us as we invest.
This material was prepared by MarketingPro, Inc., and does not necessarily represent the views of the presenting party, nor their affiliates. This information has been derived from sources believed to be accurate. Please note – investing involves risk, and past performance is no guarantee of future results. The publisher is not engaged in rendering legal, accounting or other professional services. If assistance is needed, the reader is advised to engage the services of a competent professional. This information should not be construed as investment, tax or legal advice and may not be relied on for the purpose of avoiding any Federal tax penalty. This is neither a solicitation nor recommendation to purchase or sell any investment or insurance product or service, and should not be relied upon as such. All indices are unmanaged and are not illustrative of any particular investment.
1) Markets have tended to predict election results
A simple stock market metric has correctly predicted the winner in 20 of the last 23 presidential elections since 1936 — a track record that might make even the top pollsters jealous. If the S&P 500 Index is up in the three months prior to Election Day, the incumbent party usually wins. If markets are down during that period, the opposing party typically claims victory.
Why is this? It’s because equities tend to look ahead and “price in” uncertainty — including that caused by an upcoming election.
When the stock market and the economy are strong, there is usually less motivation for a change in leadership. In those years, stocks may not need to discount the uncertainty, which often allows stocks to continue rising, further bolstering the incumbent’s chance of reelection.
When the political and economic climate are more challenging, there is a greater chance that the opposing party will win. The market discounts the added uncertainty of the election outcome and what policy changes may occur, which can lead to higher volatility.
What does this mean for 2020? As of September 15, the S&P 500 is up 3% since August 3rd (three months prior to Election Day) and 5% year-to-date. In more normal times that would favor the incumbent, but today’s shaky economy offers a different story. Since 1912, only once has a president been reelected if he oversaw a recession within two years of the election. While this trend may be interesting, investors shouldn’t use it as an excuse to try to time markets. Historically, whether the incumbent wins or loses, election volatility has usually been short-lived and quickly given way to upward moving markets.
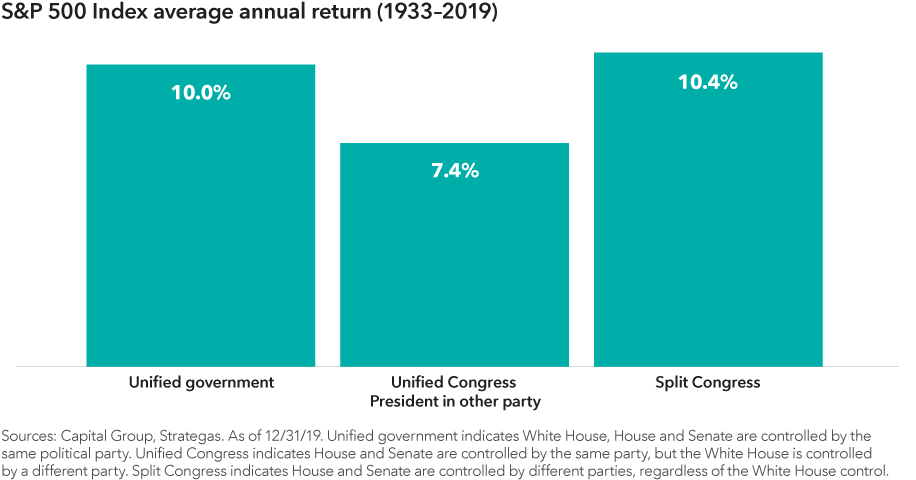
2) Gridlock or sweep? Equities have gone up either way
One of the biggest concerns investors have this election cycle is the possibility of a Democratic sweep of the White House and Congress. Many assume this so-called “blue wave” will lead to a reversal of policies like deregulation or the Tax Cuts and Jobs Act of 2017. While it’s true that a new party typically brings its own policy agenda, assuming such an outcome will lead to meaningfully lower stock prices is probably over-simplifying the complexities of stock markets.
History shows that stocks have done well regardless of the makeup of Washington. Since 1933, there have been 42 years where one party has controlled the White House and both chambers of Congress at the same time. During such periods, stocks have averaged double-digit returns. This is nearly identical to the average gains in years when Congress was split between the two parties. Historically the “least good” outcome has been when Congress is controlled by the opposite party of the president. But even this scenario notched a solid 7.4% average return.
What does this mean for 2020? This year’s election will almost certainly end in either a unified government under a blue wave or a split Congress, which could happen with either a Trump or Biden victory. Voters may have a strong preference, but investors should take comfort that both scenarios have historically produced strong equity returns.
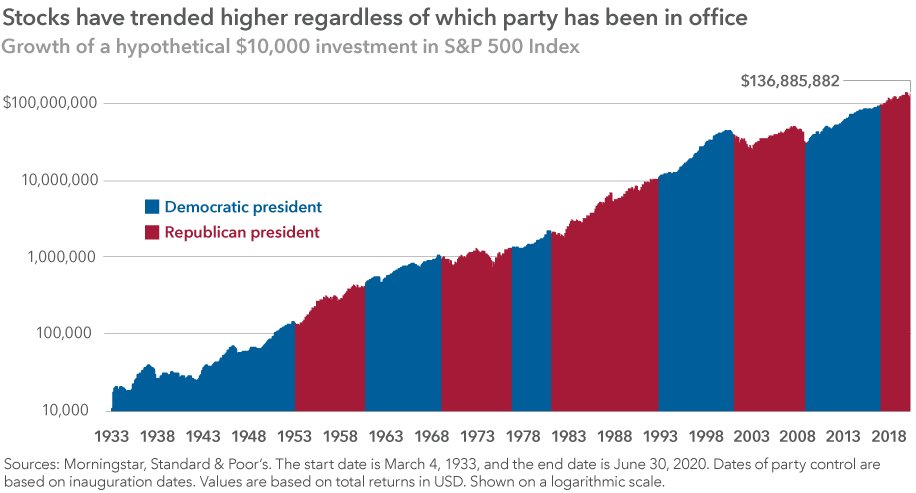
3) Markets have trended higher regardless of which party wins the election
Politics can bring out strong emotions and biases, but investors would be wise to tune out the noise and focus on the long term. That’s because elections have, historically speaking, made essentially no difference when it comes to long-term investment returns.
Which party is in power hasn’t made a meaningful difference to stocks either. Over the last 85 years, there have been seven Democratic and seven Republican presidents, and the general direction of the market has always been up. What should matter more to investors than election results is staying invested.
What does this mean for 2020? Some have called the 2020 election the most important in our lifetime. But that has been said about previous elections and will be said again about future elections. This year has been unique in countless ways, but a look at past election cycles shows that controversy and uncertainty have surrounded many campaigns. And in each case the market continued to be resilient. By maintaining a long-term focus, investors can position themselves for a brighter future regardless of the outcome on Election Day.
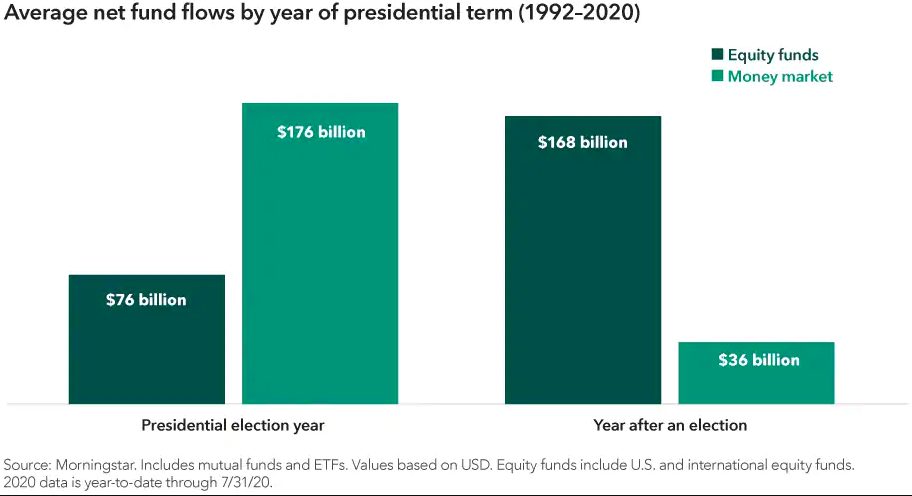
4) Investors often become more conservative in election years
It can be tough to avoid the negative messaging around election coverage. And it’s natural to allow the rhetoric of political campaigns to make us emotional. History has shown that elections have had a clear impact on investor behavior, but it’s important that investors don’t allow pessimism to steer them away from their long-term investment plan.
Investors have poured assets into money market funds — traditionally one of the lowest risk investment vehicles — to a much greater degree in election years. By contrast, equity funds have seen the highest net inflows in the year immediately following an election.
This suggests that investors want to minimize risk during election years and wait until any uncertainty has subsided to revisit riskier assets like stocks. But market timing is rarely a winning investment strategy, and it can pose a major problem for portfolio returns.
What does this mean for 2020? This trend accelerated in 2020: Through July 31, net money market flows increased $546 billion while net equity fund flows decreased $36 billion. Of course, part of this year’s flight to safety was related to the pandemic-induced recession and not the election. Still, equity funds saw their largest monthly outflows in July, indicating that investors are remaining conservative ahead of the election.
5) Moving to cash in election years can reduce long-term portfolio returns
What has been the best way to invest in election years? It isn’t by sitting on the sidelines.
To verify this, we looked at three hypothetical investors, each with a different investment approach. We then calculated the ending value of each of their portfolios over the last 22 election cycles, assuming a four-year holding period.
The investor who stayed on the sidelines had the worst outcome 16 times and only had the best outcome three times. Meanwhile, investors that were fully invested or made monthly contributions during election years came out on top. These investors had higher average portfolio balances over the full period and more frequently outpaced the investor who stayed in cash longer. These results reflect four-year holding periods, but the divergence would be even wider if compounded over longer time frames.
Sticking with a sound long-term investment plan based on individual investment objectives is usually the best course of action. Whether that strategy is to be fully invested throughout the year or to consistently invest through a vehicle such as a 401(k) plan, the bottom line is that investors should avoid market timing around politics. As is often the case with investing, the key is to put aside short-term noise and focus on long-term goals.
What does this mean for 2020? It’s too early to know what the impact of this year’s flight to cash will be on investors’ long-term portfolio returns. But with the S&P 500 soaring over 50% since the March bottom and net equity selling continuing throughout the year, it is safe to assume many investors missed at least some of this powerful equity rally and remain on the sidelines ahead of the November election.
Investments are not FDIC-insured, nor are they deposits of or guaranteed by a bank or any other entity, so they may lose value.
Investors should carefully consider investment objectives, risks, charges and expenses. This and other important information is contained in the fund prospectuses and summary prospectuses, which can be obtained from a financial professional and should be read carefully before investing.
Statements attributed to an individual represent the opinions of that individual as of the date published and do not necessarily reflect the opinions of Capital Group or its affiliates. This information is intended to highlight issues and should not be considered advice, an endorsement or a recommendation.
All Capital Group trademarks mentioned are owned by The Capital Group Companies, Inc., an affiliated company or fund. All other company and product names mentioned are the property of their respective companies.
American Funds Distributors, Inc., member FINRA.
This content, developed by Capital Group, home of American Funds, should not be used as a primary basis for investment decisions and is not intended to serve as impartial investment or fiduciary advice.
Indexes are unmanaged and, therefore, have no expenses. Investors cannot invest directly in an index.
Investing during an election year can be tough on the nerves, and 2020 promises to be no different. Politics can bring out strong emotions and biases, but investors would be wise to put these aside when making investment decisions.
Benjamin Graham, the father of value investing, famously noted that “In the short run, the market is a voting machine but in the long run, it is a weighing machine.” He wasn’t literally referring to the intersection of elections and investing, but he could have been. Markets can be especially choppy during election years, with sentiment often changing as quickly as candidates open their mouths.
Graham first made his analogy in 1934, in his seminal book, “Security Analysis.” Since then there have been 22 election cycles. Highlighted below are three common mistakes made by investors in election years and ways to avoid these pitfalls to invest with confidence in 2020.
MISTAKE #1 Investors Worry Too Much About Which Party Wins The Election
There’s nothing wrong with wanting your candidate to win, but investors can run into trouble when they place too much importance on election results. That’s because elections have, historically speaking, made essentially no difference when it comes to long-term investment returns.
“Presidents get far too much credit, and far too much blame, for the health of the U.S. economy and the state of the financial markets,” says Capital Group economist Darrell Spence. “There are many other variables that determine economic growth and market returns and, frankly, presidents have very little influence over them.”
What should matter more to investors is staying invested. Although past results are not predictive of future returns, a $1,000 investment in the S&P 500 made when Franklin D. Roosevelt took office would have been worth over $14 million today. During this time there have been exactly seven Democratic and seven Republican presidents. Getting out of the market to avoid a certain party or candidate in office could have severely detracted from an investor’s long-term returns.
By design, elections have clear winners and losers. But the real winners were investors who avoided the temptation to base their decisions around election results and stayed invested for the long haul.
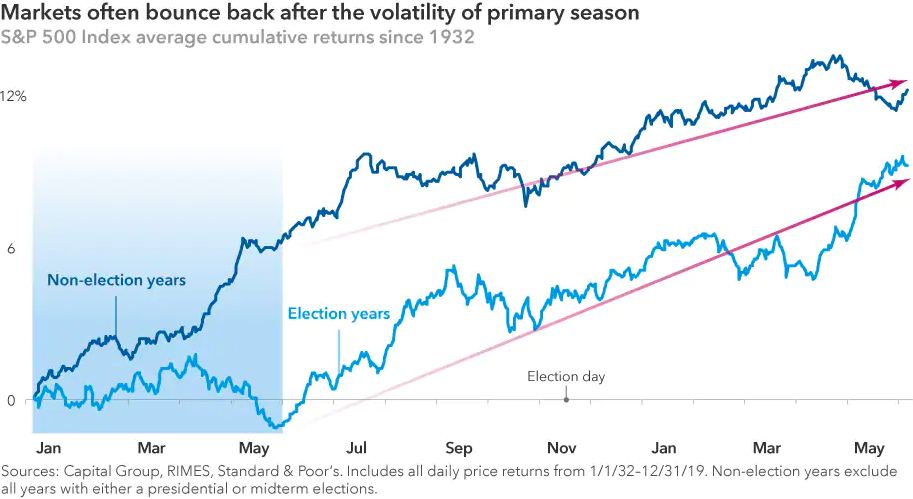
MISTAKE #2 Investors Get Spooked By Primary Season Volatility
Markets hate uncertainty, and that’s what primary season of an election year brings. For instance, with so many candidates on the campaign trail earlier this year — 11 Democrats were still running when primaries kicked off in early February — the range of outcomes were daunting.
But volatility caused by this uncertainty is often short-lived. After the primaries end and each party has selected its candidate, historically markets have tended to return to their normal trajectory.
Election year volatility can also bring select buying opportunities. Policy proposals during primaries often target specific industries, putting pressure on share prices. This cycle, it’s the health care sector that’s in the spotlight with proposed overhauls to drug pricing and the health care system.
Does that mean you should avoid this sector altogether? Not according to Rob Lovelace, an equity portfolio manager with 34 years of experience investing through many election cycles. “When everyone is worried that a new government policy is going to come along and destroy a sector, that concern is usually overblown,” Lovelace says. “Companies with good drugs that are really helping people will be able to get into the market, and they will get paid for it.”
In the past, those targeted sectors have often rallied after the campaign spotlight dimmed. It happened with health care following the 2016 presidential and 2018 midterm elections, and has happened with other sectors in the past. This can create buying opportunities for investors with a contrarian point of view and the ability to withstand short-term volatility.
MISTAKE #3 Investors Try to Time The Markets Around Politics
If you’re nervous about the markets in 2020, you’re not alone. Presidential candidates often draw attention to the country’s problems, and campaigns regularly amplify negative messages. So maybe it should be no surprise that investors have tended to be more conservative with their portfolios ahead of elections.
Since 1992, investors have poured assets into money market funds — traditionally one of the lowest risk investment vehicles — much more often leading up to elections. By contrast, equity funds have seen the highest net inflows in the year immediately after an election. This suggests that investors may prefer to minimize risk during election years and wait until after uncertainty has subsided to revisit riskier assets like stocks.
But market timing is rarely a winning long-term investment strategy, and it can pose a major problem for portfolio returns. To verify this, we analyzed investment returns over the last 22 election cycles to compare three hypothetical investment approaches: being fully invested in equities, making monthly contributions to equities, or staying in cash until after the election. We then calculated the portfolio returns after each cycle, assuming a four-year holding period.
The hypothetical investor who stayed in cash until after the election had the worst outcome of the three portfolios in 16 of 22 periods. Meanwhile, investors who were fully invested or made monthly contributions during election years came out on top. These investors had higher average portfolio balances over the full period and more often outpaced the investor who stayed on the sidelines longer.
Sticking with a sound long-term investment plan based on individual investment objectives is usually the best course of action. Whether that strategy is to be fully invested throughout the year or to consistently invest through a vehicle such as a 401(k) plan, the bottom line is that investors should avoid market timing around politics. As is often the case with investing, the key is to put aside short-term noise and focus on long-term goals.
How Can Investors Avoid These Mistakes?
Don’t allow election predictions and outcomes to influence investment decisions. History shows that election results have very little impact on long-term returns.
Expect volatility, especially during primary season, but don’t fear it. View it as a potential opportunity.
Stick to a long-term investment strategy instead of trying to time markets around elections. Investors who were fully invested or made regular, monthly investments did better than those who stayed in cash in election years.
Rob Lovelace is vice chairman of Capital Group, president of Capital Research and Management Company, and serves on the Capital Group Management Committee. He has 34 years of investment experience, all with Capital. He holds a bachelor’s in geology from Princeton and is a CFA charterholder.
Darrell Spence is an economist and research director with 27 years of investment experience, all with Capital. He earned a bachelor’s degree in economics from Occidental College and is a CFA charterholder.
Investments are not FDIC-insured, nor are they deposits of or guaranteed by a bank or any other entity, so they may lose value.
Investors should carefully consider investment objectives, risks, charges and expenses. This and other important information is contained in the fund prospectuses and summary prospectuses, which can be obtained from a financial professional and should be read carefully before investing.
Investing outside the United States involves risks, such as currency fluctuations, periods of illiquidity and price volatility. These risks may be heightened in connection with investments in developing countries. Small-company stocks entail additional risks, and they can fluctuate in price more than larger company stocks.
Statements attributed to an individual represent the opinions of that individual as of the date published and do not necessarily reflect the opinions of Capital Group or its affiliates. This information is intended to highlight issues and should not be considered advice, an endorsement or a recommendation.
American Funds Distributors, Inc., member FINRA.
This content, developed by Capital Group, home of American Funds, should not be used as a primary basis for investment decisions and is not intended to serve as impartial investment or fiduciary advice.
Methodology for the hypothetical analysis referenced in the article: The three hypothetical investors each have $10K to invest during an election cycle and are invested in a combination of equities and cash at all times. The fully invested investor is always fully invested in equities. The investor who makes monthly contributions starts with $1K in equity and $9K in cash. At the start of each of the next nine months, this investor reduces cash by $1K and makes a $1K contribution to equities, after which they will have made the full $10K contribution to equities. The investor who stays in cash until after the election is entirely invested in cash during the first year. At the start of the second year, this investor reduces cash by $10K and makes a $10K contribution to equities. S&P 500 Index used for equity returns, and reflects the reinvestment of dividends. Ibbotson SBBI US 30-Day Treasury Bill Total Return Index used as a proxy for cash returns, and reflects the reinvestment of interest. Returns and portfolio values are calculated monthly and in USD. Analysis starts on January 1 of each election year and reflects a four-year holding period.
Everyone loves a winner. If an investment is successful, most people naturally want to stick with it. But is that the best approach?
It may sound counterintuitive, but it may be possible to have too much of a good thing. Over time, the performance of different investments can shift a portfolio’s intent as well as its risk profile. It’s a phenomenon sometimes referred to as “risk creep,” and it happens when a portfolio’s risk profile shifts over time.
Balancing
When deciding how to allocate investments, many begin by considering their time horizon, risk tolerance, and specific goals. Next, individual investments are selected that pursue the overall objective. If all the investments selected had the same return, that balance – that allocation – would remain steady for a time. But if the investments have varying returns, over time, the portfolio may bear little resemblance to its original allocation. (1)
How Rebalancing Works
Rebalancing is the process of restoring a portfolio to its original risk profile. There are two ways to rebalance a portfolio.
The first is to use new money. When adding money to a portfolio, allocate these new funds to those assets or asset classes that have fallen.(1)
The second way of rebalancing is to sell enough of the “winners” to buy more underperforming assets. Ironically, this type of rebalancing forces you to buy low and sell high.
As you consider the pros and cons of rebalancing, here are a couple of key concepts to consider. First, asset allocation is an investment principle designed to manage risk. It does not guarantee against investment losses. Second, the process of rebalancing may create a taxable event. And the information in this material is not intended as tax or legal advice. It may not be used for the purpose of avoiding any federal tax penalties. Please consult a professional with legal or tax expertise regarding your situation. Periodically rebalancing your portfolio to match your desired risk tolerance is a sound practice regardless of the market conditions. One approach is to set a specific time each year to schedule an appointment to review your portfolio and determine if adjustments are appropriate.
The left hand side of this page shows the benefits of diversification during the most recent stock market correction while the right hand side shows how the market itself can rebalance portfolios overtime.
This material was prepared by MarketingPro, Inc., and does not necessarily represent the views of the presenting party, nor their affiliates. This information has been derived from sources believed to be accurate. Please note – investing involves risk, and past performance is no guarantee of future results. The publisher is not engaged in rendering legal, accounting or other professional services. If assistance is needed, the reader is advised to engage the services of a competent professional. This information should not be construed as investment, tax or legal advice and may not be relied on for the purpose of avoiding any Federal tax penalty. This is neither a solicitation nor recommendation to purchase or sell any investment or insurance product or service, and should not be relied upon as such. All indices are unmanaged and are not illustrative of any particular investment.
Undeniably, spring 2020 has tried the patience of investors. An 11-year bull market ended. Key economic indicators went haywire. Household confidence was shaken. The Standard & Poor’s 500, the equity benchmark often used as shorthand for the broad stock market, settled at 2,237.40 on March 23, down 33.9% from a record close on February 19. (1)
On April 17, the S&P closed at 2,874.56. In less than a month, the index rallied 28.5% from its March 23 settlement. And while past performance does not guarantee future results, there is a lesson in numbers like these. (1)
In the stock market, confidence can quickly erode – but it can also quickly emerge.
That should not be forgotten.
There have been many times when economic and business conditions looked bleak for stock investors. The Dow Jones Industrial Average dropped 30% or more in 1929, 1938, 1974, 2002, and 2009. Some of the subsequent recoveries were swift; others, less so. But after each of these downturns, the index managed to recover. (2)
Sometimes the stock market is like the weather in the Midwest.
As the old Midwestern cliché goes, if you don’t care for the weather right now, just wait a little while until it changes.
The stock market is inherently dynamic. In tough times, it can be important to step back from the “weather” of the moment and realize that despite the short-term volatility, stocks may continue to play a role in your long-term investment portfolio.
When economic and business conditions appear trying, that possibility is too often dismissed or forgotten. In the midst of a bad market, when every other headline points out more trouble, it can be tempting to give up and give in.
Confidence comes and goes on Wall Street
The paper losses an investor suffers need not be actual losses. In a down market, it is perfectly fine to consider, worry about, and react to the moment. Just remember, the moment at hand is not necessarily the future, and the future could turn out to be better than you expect.
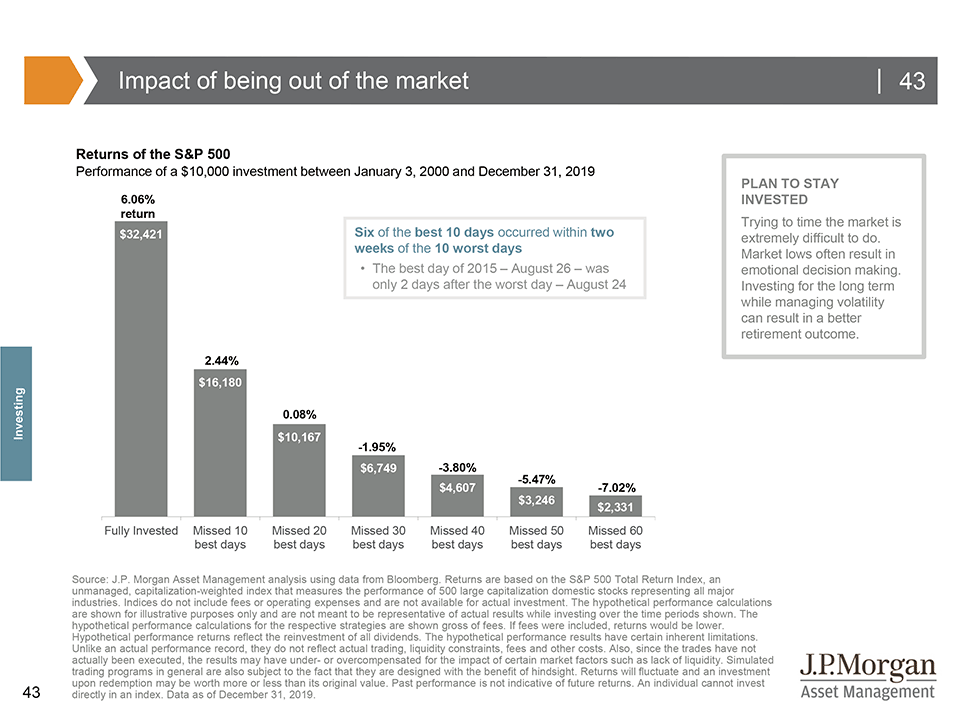
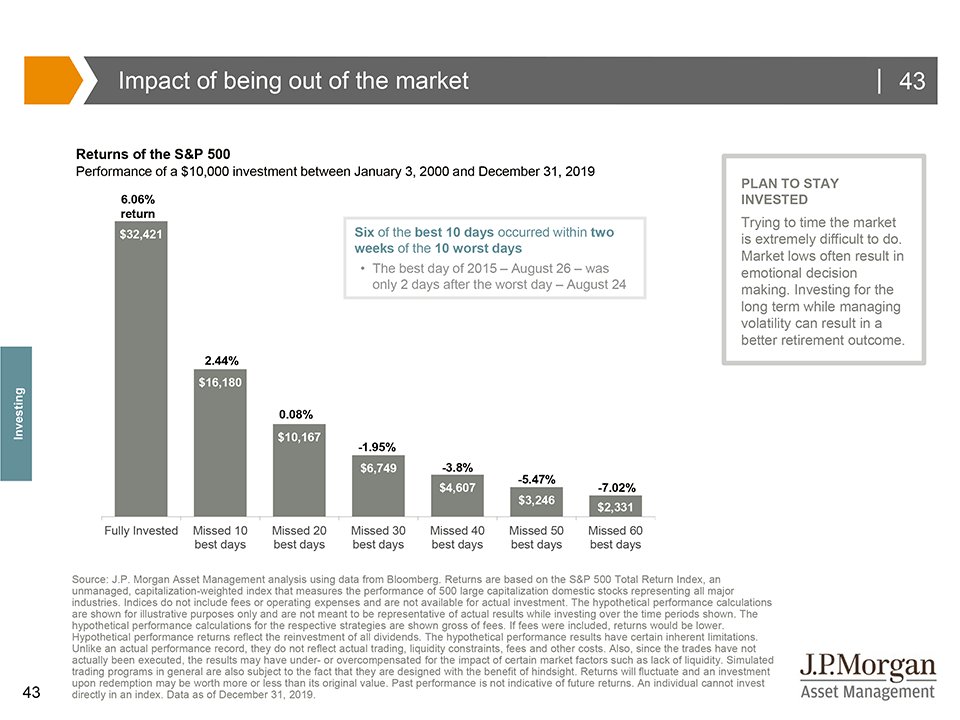
During periods of extreme market declines, a natural emotional reaction can be to sell out of the market and seek safety in cash. The results of this reaction can be devastating because often the best days occur close to the worst days during periods of market volatility. This chart compares an individual who was fully invested for the past 20 years in the S&P 500 to investors who missed some of the best days as a result of being out of the market for a period of time. Missing the top 10 best days will halve the annualized return; missing the top 30 days will result in a negative annualized return on the original $10,000 investment. Rather than emotionally reacting to or trying to time the market, adopting a disciplined long-term investment strategy may produce a better retirement outcome.
Keep in mind that the return and principal value of stock prices will fluctuate as market conditions change. And shares, when sold, may be worth more or less than their original cost.
This material was prepared by MarketingPro, Inc., and does not necessarily represent the views of the presenting party, nor their affiliates. This information has been derived from sources believed to be accurate. Please note – investing involves risk, and past performance is no guarantee of future results. The publisher is not engaged in rendering legal, accounting or other professional services. If assistance is needed, the reader is advised to engage the services of a competent professional. This information should not be construed as investment, tax or legal advice and may not be relied on for the purpose of avoiding any Federal tax penalty. This is neither a solicitation nor recommendation to purchase or sell any investment or insurance product or service and should not be relied upon as such. All indices are unmanaged and are not illustrative of any particular investment.
The COVID-19 outbreak has put tremendous pressure on stock prices, prompting some investors to blindly and indiscriminately sell positions at a time when the entire market is trending lower. Worried investors believe “this time it’s different.” When the market drops, some investors lose perspective that downtrends – and uptrends – are part of the investing cycle. When stock prices break lower, it’s a good time to review common terms that are used to describe the market’s downward momentum. (1,2)
Pullbacks
A pullback represents the mildest form of a selloff in the markets. You might hear an investor or trader refer to a dip of 5% to 10% after a peak as a “pullback.” (1)
Corrections
The next degree in severity is a “correction.” If a market or markets retreats 10% to 20% after a peak, you’re in correction territory. At this point, you’re likely on guard for the next tier. (1)
Bear Market
In a bear market, the decline is 20% or more since the last peak. (1)
All This is Normal
Pullbacks, corrections, and bear markets are a part of the investing cycle. When stock prices are trending lower, some investors can second-guess their risk tolerance. But periods of market volatility can be the worst time to consider portfolio decisions.
Pullbacks and corrections are relatively common and represent something that any investor may see in their financial life, from time to time – often, several times over the course of a decade. Bear markets are much rarer. What we are experiencing now represents the start of the ninth bear market since 1926. This bear market follows the longest bull market on record. (1)
How is This Bear Market Going to Affect You?
That’s a good question, but it’s something that you won’t fully understand in the here and now. The average bear market lasts 146 days for the Standard & Poor’s 500. (2)
A retirement strategy, formed with the help of a trusted financial professional, has market volatility factored in. As you continue your relationship with that professional, they will also be at your side to make any adjustments as needed and help you make any necessary decisions along the way. Their goal is to help you pursue your goals.
This chart shows historical recessions, their corresponding bear markets (a 20% market decline from the previous all-time high), what caused them, and the magnitude of the drawdown.
This is meant to illustrate that lofty valuations are not predictors of bear markets, but rather, bear markets are caused by external factors such as geopolitical conflict, monetary policy action and recession. (3) (Click chart for larger view)
This material was prepared by MarketingPro, Inc., and does not necessarily represent the views of the presenting party, nor their affiliates. This information has been derived from sources believed to be accurate. Please note – investing involves risk, and past performance is no guarantee of future results. The publisher is not engaged in rendering legal, accounting or other professional services. If assistance is needed, the reader is advised to engage the services of a competent professional. This information should not be construed as investment, tax or legal advice and may not be relied on for the purpose of avoiding any Federal tax penalty. This is neither a solicitation nor recommendation to purchase or sell any investment or insurance product or service, and should not be relied upon as such. All indices are unmanaged and are not illustrative of any particular investment.
No doubt the market gyrations of the last several weeks have rattled the nerves of many investors.
Sharp market declines and volatility are built around uncertainty, whether it be in the financial system (e.g. 2008), terrorist events (2001), commodity price shocks (1970s), wars, or other surprises. It’s easy for investors to forget in hindsight that the very nature of these historical events did not lend themselves to certain interpretation or resolution while they were happening. This is why the ‘price discovery’ mechanism of markets can get off-track, divergent from the more predictable modeling of earnings, dividends, and interest rates. (1)
“In the short run, stock returns are very volatile, driven by changes in earnings, interest rates, risk, and uncertainty, as well as psychological factors, such as optimism and pessimism as well as fear and greed.”
In times like this, though, when information is fluid, estimates are difficult. The severity of the downturn and market reaction will likely depend on a variety of factors. These include government action and fiscal stimulus to assist those out of work in the service and entertainment industries, and, most importantly, the progression of COVID-19 cases, and any signs of these peaking or decelerating. When financial markets move beyond rational pricing, non-financial indicators take on greater importance than they normally would. (1)
“It took just over 15 years to recover the money invested at the 1929 peak… And since World War II, the recovery period for stocks has been even better. Even including the recent financial crisis (2008), which saw the worst bear market since the 1930s, the longest it has ever taken an investor to recover an original investment in the stock market (including reinvested dividends) was the five-year, eight-month period from August 2000 through April 2006.”
Recognize that stocks are long-term investments – Historically stocks tend to overreact on both the upside and the downside and eventually recover.
Recognize that the market has already de-risked investors – You may now have less equity exposure.
Look at valuation gaps – Not every investment is equally priced.
Think about income – The S&P 500 yield is greater than current Treasury yields.
Active managers should do well during this period – Mutual Fund managers can help us navigate these choppy waters and help separate the potential winners from the losers.
The Markets Will Adapt
If you believe, like I do, that we will eventually recover from this crisis then we’ll need to lean into what we do know from past market (and investor) behavior. Here are four charts that help provide a better understanding (click charts for expanded view):
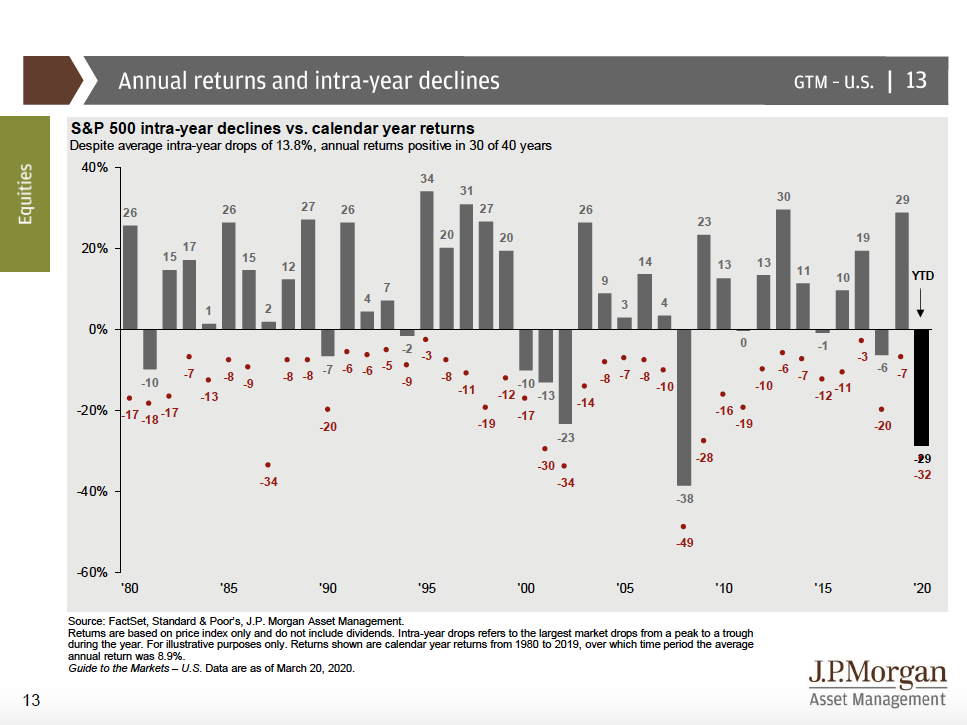
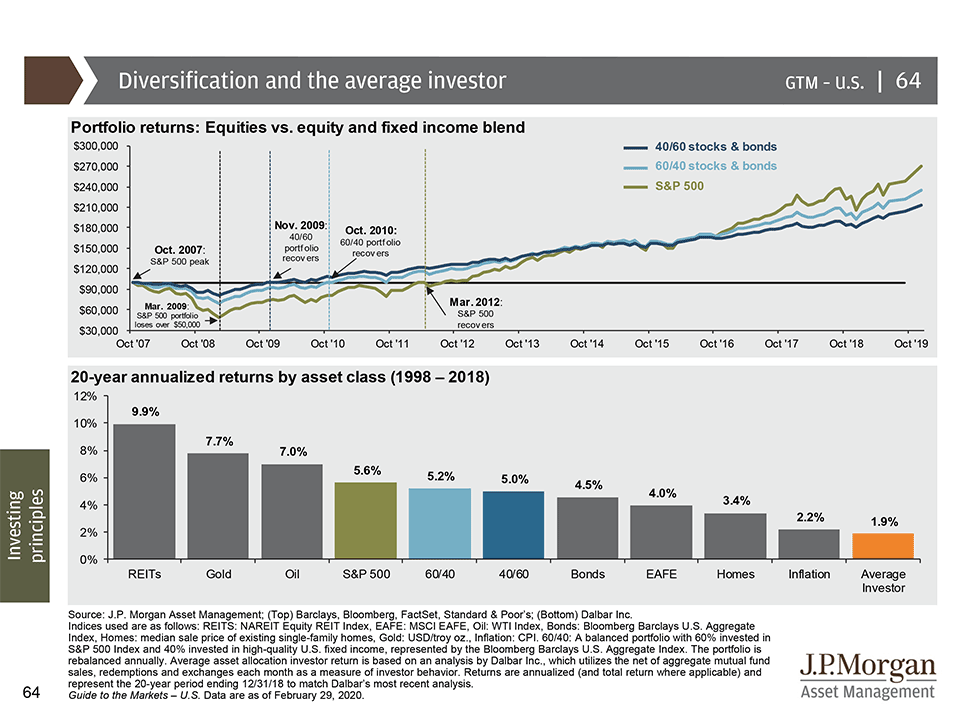
This chart shows intra-year stock market declines (red dot and number), as well as the market’s return for the full year (gray bar). What is clear is that the market is capable of recovering from intra-year drops and finishing the year in positive territory, which should encourage investors to stay the course when markets get choppy. (3)The top chart shows the powerful effects of portfolio diversification. It illustrates the difference in movements between the S&P 500, a 60/40 portfolio and a 40/60 portfolio indicating when each respective portfolio would have recovered its original value at the peak of the market in 2007 from the market bottom in 2009. It shows that the S&P 500 fell far more than either of the two diversified portfolio and also took two or more years longer to recover its value. (3)
The bottom chart shows 20-year annualized returns by asset class, as well as how an “average investor” would have fared. The average investor asset allocation return is based on an analysis by Dalbar, which utilizes the net of aggregate mutual fund sales, redemptions and exchanges each month as a measure of investor behavior. (3) Carl Richards coined this the “Behavior Gap” in his book “The Behavior Gap: Simple Ways to Stop Doing Dumb Things with Money”This chart shows historical returns by holding period for stocks, bonds and a 50/50 portfolio, rebalanced annually, over different time horizons. The bars show the highest and lowest return that you could have gotten during each of the time periods (1-year, 5-year rolling, 10-year rolling and 20-year rolling). This chart advocates for simple, balanced portfolios, as well as for having an appropriate time horizon. (3)During periods of extreme market declines, a natural emotional reaction can be to sell out of the market and seek safety in cash. The results of this reaction can be devastating because often the best days occur close to the worst days during periods of market volatility. This chart compares an individual who was fully invested for the past 20 years in the S&P 500 to investors who missed some of the best days as a result of being out of the market for a period of time. Missing the top 10 best days will halve the annualized return; missing the top 30 days will result in a negative annualized return on the original $10,000 investment. Rather than emotionally reacting to or trying to time the market, adopting a disciplined long-term investment strategy may produce a better retirement outcome. (3)
This guide walks through a simple framework to help you think clearly about retirement—from defining what matters most to understanding how your financial pieces fit together.
If you’re looking for help with retirement planning or investment management, you can learn more about how I work with clients at Weiss Financial Group.
Weiss Financial Group is a registered investment advisor. Information presented is for educational purposes only and does not intend to make an offer or solicitation for the sale or purchase of any specific securities product, service, or investment strategy. Investments involve risk and unless otherwise stated, are not guaranteed. Be sure to first consult with a qualified financial adviser, tax professional, or attorney before implementing any strategy or recommendation discussed herein. Insurance products and services are offered through individually licensed and appointed agents in all applicable jurisdictions. The advisers at Weiss Financial Group are not attorneys of a law firm but can provide guidance to the client’s other professionals.
Scott Weiss, CFP®
RICP®, CRPC®, AAMS®, AWMA®, APMA®, CMFC®
ADDRESS:
704 Route 6
Mahopac, NY 10541
PHONE:
845-621-4700
Want more insights like this?
Get thoughtful, planning-focused insights delivered occasionally.
No noise. Just practical, planning-focused perspective. Unsubscribe anytime.