Look beyond this moment and stay focused on your long-term objectives.
Volatility will always be around on Wall Street, and as you invest for the long term, you must learn to tolerate it. Rocky moments, fortunately, are not the norm.
Since the end of World War II, there have been dozens of Wall Street shocks.
Wall Street has seen 56 pullbacks (retreats of 5-9.99%) in the past 73 years; the S&P index dipped 6.9% in this last one. On average, the benchmark fully rebounded from these pullbacks within two months. The S&P has also seen 22 corrections (descents of 10-19.99%) and 12 bear markets (falls of 20% or more) in the post-WWII era. (1)
Even with all those setbacks, the S&P has grown exponentially larger. During the month World War II ended (September 1945), its closing price hovered around 16. At this writing, it is above 2,750. Those two numbers communicate the value of staying invested for the long run. (2)
This current bull market has witnessed five corrections, and nearly a sixth (a 9.8% pullback in 2011, a year that also saw a 19.4% correction). It has risen roughly 335% since its beginning even with those stumbles. Investors who stayed in equities through those downturns watched the major indices soar to all-time highs. (1)
As all this history shows, waiting out the shocks may be highly worthwhile.
The alternative is trying to time the market. That can be a fool’s errand. To succeed at market timing, investors have to be right twice, which is a tall order. Instead of selling in response to paper losses, perhaps they should respond to the fear of missing out on great gains during a recovery and hang on through the choppiness.
After all, volatility creates buying opportunities. Shares of quality companies are suddenly available at a discount. Investors effectively pay a lower average cost per share to obtain them.
Bad market days shock us because they are uncommon.
If pullbacks or corrections occurred regularly, they would discourage many of us from investing in equities; we would look elsewhere to try and build wealth. A decade ago, in the middle of the terrible 2007-09 bear market, some investors convinced themselves that bad days were becoming the new normal. History proved them wrong.
As you ride out this current outbreak of volatility, keep two things in mind.
One, your time horizon. You are investing for goals that may be five, ten, twenty, or thirty years in the future. One bad market week, month, or year is but a blip on that timeline and is unlikely to have a severe impact on your long-run asset accumulation strategy. Two, remember that there have been more good days on Wall Street than bad ones. The S&P 500 rose in 53.7% of its trading sessions during the years 1950-2017, and it advanced in 68 of the 92 years ending in 2017. (3,4)
Sudden volatility should not lead you to exit the market.
If you react anxiously and move out of equities in response to short-term downturns, you may impede your progress toward your long-term goals.
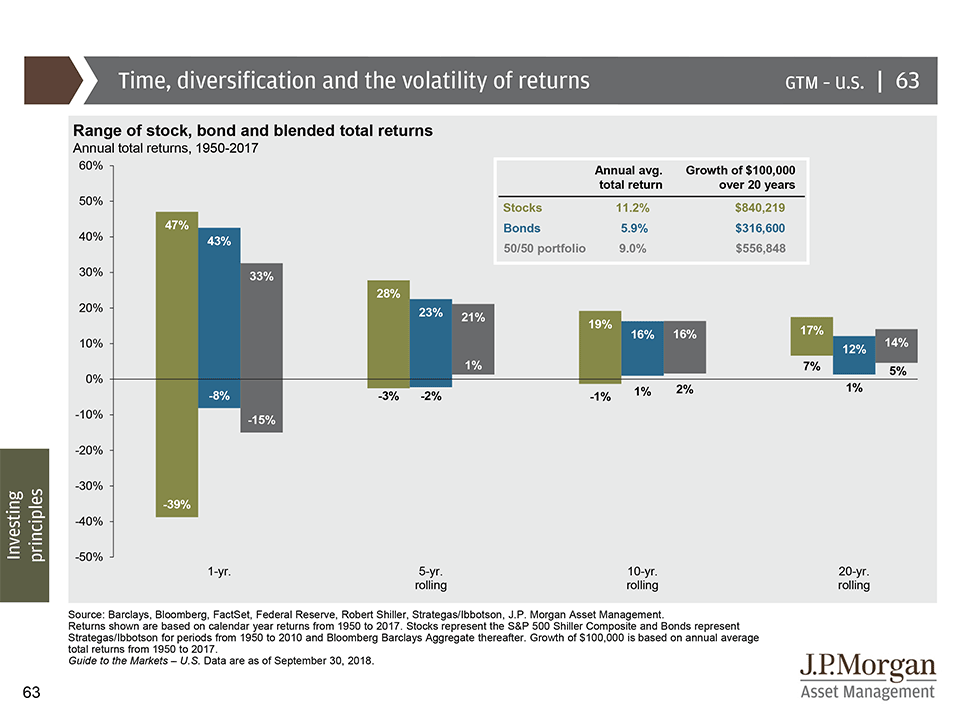
▲ Time, diversification and the volatility of returns
This chart shows historical returns by holding period for stocks, bonds and a 50/50 portfolio, rebalanced annually, over different time horizons. The bars show the highest and lowest return that you could have gotten during each of the time periods (1-year, 5-year rolling, 10-year rolling and 20-year rolling). This page advocates for simple balanced portfolio, as well as for having an appropriate time horizon.
This material was prepared by MarketingPro, Inc., and does not necessarily represent the views of the presenting party, nor their affiliates. This information has been derived from sources believed to be accurate. Please note – investing involves risk, and past performance is no guarantee of future results. The publisher is not engaged in rendering legal, accounting or other professional services. If assistance is needed, the reader is advised to engage the services of a competent professional. This information should not be construed as investment, tax or legal advice and may not be relied on for avoiding any Federal tax penalty. This is neither a solicitation nor recommendation to purchase or sell any investment or insurance product or service, and should not be relied upon as such. All indices are unmanaged and are not illustrative of any particular investment.
Most people worry about not having enough money for retirement. But did you also know that there is such a thing as having too much money? Too much money may not necessarily be a bad thing, but you do need to worry about required minimum distributions (RMDs). Here’s what you need to know about RMDs.
RMDs Depend on Your Age
The main point of RMDs is to keep money from staying tax-free forever. The government gave a temporary tax break to encourage you to save for retirement, but it still wants that tax money. A required minimum distribution is a required withdrawal from your retirement account. It counts in your taxable income just like any other withdrawal in retirement.
Currently, RMDs start when you hit age 72 (or 70½ if you turned 70½ prior to January 1, 2020) and they are calculated to empty your retirement account within your expected life expectancy. (1) Each year, you need to withdraw a certain percentage of your account with the percentage going up as you age. However, it’s important to realize that you do not have to spend all of this money. You can also reinvest it into a taxable account.
Not Taking the RMD Can Mean Big Penalties
Thinking about skipping RMDs to avoid taxes? Think again. Not only do you still have to pay the taxes on the RMD amount, but you’ll also owe a 50 percent penalty.
For example, if you were supposed to withdraw $10,000 but didn’t, the IRS will charge you an extra $5,000. The penalty repeats every year until you catch up on your RMDs from previous years.
RMDs Can Throw a Wrench in Your Tax Planning
There are many reasons why you might want to reduce your taxable income in retirement. These can include qualifying for things like Medicaid subsidies, avoiding taxes on your Social Security benefits, trying to stay in a lower capital gains tax bracket, or just wanting to pay fewer taxes.
Required minimum distributions can throw a major wrench in your tax planning because not only are they not avoidable, they can suddenly increase if the market surges. If you’re using a tax strategy that requires reducing your income to a certain level, it’s important to build in flexibility for your RMDs.
RMDs Can Be Avoided
There are still ways to reduce or even avoid RMDs altogether. The main idea is to get the money out of your retirement account when you want to not when the IRS wants you to.
One method is to make extra withdrawals at the end of the year. In December, you can estimate your taxes for the year. If you still have room in a lower tax bracket or below the income you need to stay under, you can withdraw additional money. When next year’s RMDs are calculated, it will be on a lower account balance.
You can also convert to a Roth IRA instead of taxing the money out of a tax-advantaged account. Roth IRAs don’t have RMDs because the money has already been taxed. When you make the conversion, you pay ordinary income tax rates on the amount you converted. There are no penalties even if you do the conversion before you turn 59 1/2.
This content is developed from sources believed to be providing accurate information, and provided by Twenty Over Ten. It may not be used for the purpose of avoiding any federal tax penalties. Please consult legal or tax professionals for specific information regarding your individual situation. The opinions expressed and material provided are for general information, and should not be considered a solicitation for the purchase or sale of any security.
Most likely, you’ve heard what’s brewing in Washington, D.C., called by one of these names.
The Build Back Better Act.
Or the $3.5 trillion budget reconciliation bill. Or the Jobs and Economic Recovery Plan for Working Families. (1)
Regardless of what name you’ve heard, one fact is clear: It is likely to be months before any action is taken.
When bills are being worked on—especially one that’s this size—it’s a good time to take a quick Civics refresher. Right now, the bill is “in committee” with both the House of Representatives and the Senate. The committees are filling in the policy details and the exact financial figures, which can be a long process. (2)
It will then be up to the House and Senate to vote on an identical version of a final bill—if both can agree to a final version. (2)
Right now, it would be hasty to make any portfolio changes based on what’s being discussed and debated. An ambitious investor would have to guess at what policies will be in the final bill, estimate the financial impact, and determine what portfolio changes should be made. That’s a tall order.
So as difficult as it may be, the best approach is to wait-and-see.
This article is for informational purposes only and is not a replacement for real-life advice, so make sure to consult your tax, legal, and financial professionals before modifying your tax strategy.
This material was prepared by MarketingPro, Inc., and does not necessarily represent the views of the presenting party, nor their affiliates. This information has been derived from sources believed to be accurate. Please note – investing involves risk, and past performance is no guarantee of future results. The publisher is not engaged in rendering legal, accounting or other professional services. If assistance is needed, the reader is advised to engage the services of a competent professional. This information should not be construed as investment, tax or legal advice and may not be relied on for the purpose of avoiding any Federal tax penalty. This is neither a solicitation nor recommendation to purchase or sell any investment or insurance product or service, and should not be relied upon as such. All indices are unmanaged and are not illustrative of any particular investment.
In August of 2020, the Fed announced that it is willing to allow inflation to run higher than normal in order to support the labor market and broader economy. This major policy shift allows inflation to run above the Fed’s 2% goal for some time before the Fed would consider increasing short-term interest rates in an attempt to combat higher prices. (1)
These robust changes to the Fed’s long-standing inflation policy further illustrates the importance of understanding how inflation is reported and how it can affect your investments.
What Is Inflation?
Inflation is defined as an upward movement in the average level of prices. Each month, the Bureau of Labor Statistics releases a report called the Consumer Price Index (CPI) to track these fluctuations. It was developed from detailed expenditure information provided by families and individuals on purchases made in the following categories: food and beverages, housing, apparel, transportation, medical care, recreation, education and communication, and other groups and services. (2)
How Applicable Is the CPI?
While it’s the commonly used indicator of inflation, the CPI has come under scrutiny. For example, the CPI rose 1.4 percent for the 12-months ending in January 2021 – a relatively small increase. However, a closer look at the report shows movement in prices on a more detailed level. Used car and truck prices, for example, rose 10 percent during those 12 months. (3)
As Inflation Rises and Falls, Three Notable Effects are Observed:
First, inflation reduces the real rate of return on investments. So, if an investment earned 6 percent for a 12-month period, and inflation averaged 1.5 percent over that time, the investment’s real rate of return would have been 4.5 percent. If taxes are considered, the real rate of return may be reduced even further. (4)
Second, inflation puts purchasing power at risk. When prices rise, a fixed amount of money has the power to purchase fewer and fewer goods.
Third, inflation can influence the actions of the Federal Reserve. If the Fed wants to control inflation, it has various methods for reducing the amount of money in circulation. Hypothetically, a smaller supply of money would lead to less spending, which may lead to lower prices and lower inflation.
Empower Yourself with a Trusted Professional.
When inflation is low, it’s easy to overlook how rising prices are affecting a household budget. On the other hand, when inflation trends higher, it may be tempting to make more sweeping changes in response to increasing prices. The best approach may be to reach out to your financial professional to help you develop an investment strategy that takes both possible scenarios into account.
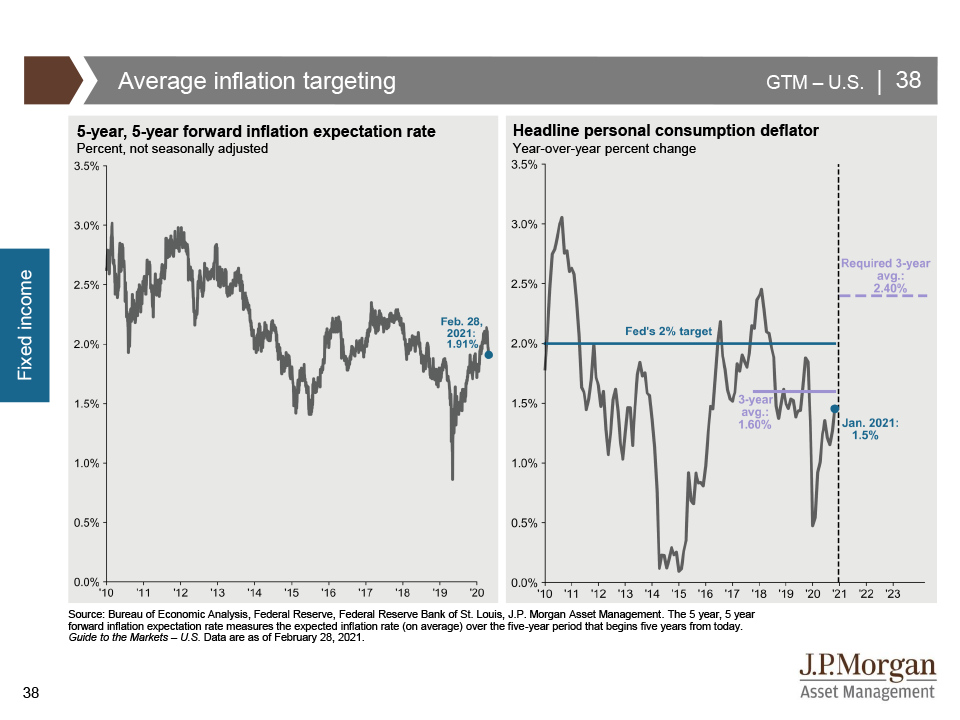
Average Inflation Targeting
This page shows inflation expectations and the headline personal consumption deflator over time. The Federal Reserve’s policy framework of average inflation targeting seeks to push up inflation expectations (left) and will allow for a period of inflation over their 2% target, indicating that they are more concerned about the prospect of too little inflation, rather than too much. (5)
This is a hypothetical example used for illustrative purposes only. It is not representative of any specific investment or combination of investments. Past performance does not guarantee future results.
This material was prepared by MarketingPro, Inc., and does not necessarily represent the views of the presenting party, nor their affiliates. This information has been derived from sources believed to be accurate. Please note – investing involves risk, and past performance is no guarantee of future results. The publisher is not engaged in rendering legal, accounting or other professional services. If assistance is needed, the reader is advised to engage the services of a competent professional. This information should not be construed as investment, tax or legal advice and may not be relied on for the purpose of avoiding any Federal tax penalty. This is neither a solicitation nor recommendation to purchase or sell any investment or insurance product or service, and should not be relied upon as such. All indices are unmanaged and are not illustrative of any particular investment.
At this time last year, it was still unknown that a deadly global pandemic was on the rise, eventually stalling economic growth and sending crude oil prices into negative territory. But recently, oil prices have surged, with crude hitting highs not seen since before the pandemic.
A Hopeful Sign
Recent production cuts and a belief in the potential for underlying economic growth are spurring a rally. Although the demand for oil is still lower than normal, many investment professionals harbor hopes of a speedier than expected economic recovery thanks to the ongoing global vaccination effort. (1)
Oil Prices and the Economy
The price of oil can often influence the costs of other production and manufacturing across the United States. For example, there is a direct correlation between the cost of gasoline or airplane fuel to the price of transporting goods and people. A drop in fuel prices means lower transport costs and cheaper airline tickets. (2)
The Ultimate Lead Indicator?
Some investment professionals view the value of oil as a lead indicator. Whether or not this will remain true for the future, it can be helpful to remember that lead indicators should never be seen as infallible. Abrupt and unexpected changes will prompt lead indicators to rapidly recalibrate their expectations for the future.
These forecasts or forward-looking statements are based on assumptions, subject to revision without notice, and may not materialize.
Investing involves risks, and investment decisions should be based on your own goals, time horizon and tolerance for risk. The return and principal value of investments will fluctuate as market conditions change. When sold, investments may be worth more or less than their original cost.
This material was prepared by MarketingPro, Inc., and does not necessarily represent the views of the presenting party, nor their affiliates. This information has been derived from sources believed to be accurate. Please note – investing involves risk, and past performance is no guarantee of future results. The publisher is not engaged in rendering legal, accounting or other professional services. If assistance is needed, the reader is advised to engage the services of a competent professional. This information should not be construed as investment, tax, or legal advice and may not be relied on for the purpose of avoiding any Federal tax penalty. This is neither a solicitation nor recommendation to purchase or sell any investment or insurance product or service, and should not be relied upon as such. All indices are unmanaged and are not illustrative of any particular investment.
Lafayette, US – December 27, 2016: GameStop Strip Mall Location. GameStop is a Video Game and Electronics Retailer IV
As a long term investors we do not spend too much time on market anomalies, let alone individual stocks that fall outside long-term asset allocation principles, but this seems to have taken over the headlines last week. Rarely do stock market quirks become mainstream news; in this case, it carried over to market sentiment to some extent and definitely raised trading volumes.
What Happened?
GameStop is a video game retailer, and an example of a stock that has been a favorite recent target of short-sellers. This is largely because of skepticism about the company’s long-term business fundamentals (the stock was selling at under $5/share). Like many brick-and-mortar based retailers, Covid has accelerated the movement to online commerce, and has punished these types of companies—putting their future in greater doubt. Taking a step back, selling a stock short is practically the most negative view an investor can take, since it’s the polar opposite of owning it. It involves borrowing the shares from another party, and selling them in advance, so in essence hoping for a sharp downturn to re-buy (‘cover’) the position later at a lower price. So it’s like buy low, sell high, excepted executed in reverse. Investors like hedge funds (often in long/short or market neutral strategies) take short positions in companies for reasons like weak financial prospects, over-optimistic expectations, or even potential fraud. Naturally, this can be risky, especially if extra leverage is used. Such investors may even convey bad news about a company to weaken its stock price, which sounds odd at first thought, but really is not that much different than Warren Buffet talking about his admiration for Coca-Cola—hoping the stock price goes up.
Based on reports, it seems a group of retail investors (presumably video game fans, who may have taken the GameStop assault personally) decided to take a stand against ‘greedy’ hedge funds and punish them for taking advantage of these troubled companies. In that sense, this has been described as a morality play (and/or these folks have given hedge funds too much credit, as fund failures are far more common than successes, but not as publicized). They’ve gathered support on Reddit, an online news aggregator and discussion site, as well as Twitter and other forums. By buying large amounts of the stock in aggregate, as well as that of a few other market short targets, like BlackBerry, AMC, and Bed Bath & Beyond, the group hoped to create a ‘short squeeze’. This happens when demand for owning long positions turns the tables on and overwhelms short position holders, pushing prices sharply higher, and creating huge losses for the shorts. Short squeezes can result in dramatic market movements, but have been a common practice for centuries, and often involving well-known investors. Similar to past cases, the result this time has been a sharp increase in volatility and quick and extreme price jumps for several of these companies. It also creates a feedback loop where the more (unjustifiably) expensive a stock gets, the greater the interest and potential profit in shorting it—if the shorts can hold on long enough, suffering losses in the meantime. Shorting is a risky bet, since a stock can fall to a limit of $0, but losses are theoretically unlimited (the stock price can grow to the sky, and the shorting party has to return the borrowed shares at some point, regardless of price).
In addition, this has been described as the mobilization of a populist effort to ‘re-democratize’ Wall Street. While this sounds dramatic, the backdrop is favorable to something like this happening. With brokerages offering easy-to-use platforms and commission-free trades, and some investors with a lot of free time on their hands due to Covid. This may have turned some trading sites into a ‘gaming’ interface of their own, rather than a vehicle to allocate investments for conventional reasons. It’s been suggested that such activity emerging may be signs of a broader bullishness in equity markets without fundamental basis, but in reality these events have occurred before over the years as one-offs rather than part of larger trends. (It happened with trading in ‘volatility’ strategies a few years ago and famously with silver in 1980.) This type of event is naturally easier with smaller, cheap companies, than large ones with strong mainstream demand. AMC has already taken advantage of the new ‘popularity’ in its stock by issuing more equity.
Will the Fed or SEC Impose Additional Regulations?
There have been calls for the Fed to raise Reg T margin requirements to stem this speculative behavior, at least via leverage, but brokerage firms have put on their own limits in some cases. (Bans on GameStop and other stocks have already been implemented by Robinhood, a favored broker for small investors, resulting in its own backlash from those opposing restrictions. A credit crunch on their part seemed to be partially behind it.) Unless this behavior becomes much more widespread and systematic, affecting overall U.S. financial stability, this is out of the Fed’s mandate. The SEC is investigating under the premise that this could be considered organized stock manipulation (through the online messages), along the same lines as a classic ‘pump and dump’ scheme. Insider trading has also been mentioned, but that seems more of a longshot, unless actual company insider information was shared and used. Time will tell whether a formal criminal case of any kind occurs.
This brings up a variety of potential issues, though, including how to regulate (or not regulate) this type of market activity. Many retail investors seem to see this as an ‘us versus them’ moment. On a deeper level, what is considered a fair market? Should smaller investors be protected from themselves? Or, should they be allowed to take the same risks as institutions? Who gets the blame if this turns out badly? How much leeway to give securities markets has been a long-standing question for much of the past century and prior. More regulation tends to pop up if things end badly, which of course they could here, if small investors end up losing their shirts. There is talk again of regulating the shorting of stocks, but the counterargument is that short sellers play an important economic role in efficient market price discovery and keeping supply/demand conditions in balance. Removing these bearish folks could create even more unpredictable stock price behavior, and infuse a tilt toward perpetual bullishness. Of course, this could have its own set of eventual problems.
The 3 Legs of Successful Long Term Investing
During times of market volatility it is important as long term investors to remember the three legs of successful investing:
Each year naturally brings more surprises than certainties, so outlooks and predictions of any kind quickly become futile. (We’ve already experienced a dramatic and unusual first week of January.) At least at this point in time, noted are a few key issues to monitor as 2021 gets going:
Covid Pandemic
This is the one carryover from 2020 everyone would like to forget. Unfortunately, it remains the single most important issue for both global medical and economic health going into 2021. While acknowledging the loss and hardship for many over the past year, the pandemic has also led to many examples of resiliency. It has resulted in a relatively smooth transition into work-from-home environments for some, but has also caused immeasurable problems for vulnerable cyclical industries forced to close or operate at reduced capacity. The development of several effective vaccines has taken an open-ended economic disaster and turned it into one with a clearer end game, assuming their distribution and effectiveness across populations go as planned. Mid-2021 is the current estimate for higher levels of implementation across the broader population (a goal of near-herd immunity) and some semblance of a ‘back to normal.’ But so far, logistics have been slow for vaccine rollout, so the economic normalization process seem more likely to be pushed back than bumped up, but the situation remains fluid. (Many are watching the rollout process in Israel, which has handled logistics very quickly and already inoculated nearly a quarter of their population, for clues.) The discovery of a new strain of Covid adds additional uncertainty to the mix, with hopes from health professionals that current vaccine technology won’t be derailed by this or further virus mutations.
Presidential Actions
The election of Joe Biden has led to assumed better consistency of behavior in the executive branch, but has also moved policy several ticks toward the left. Relative to others in the Democratic party, though, Biden is considered a ‘centrist’ and finder of common ground. In the best case, this may result in legislation backed by both sides of the aisle. However, the January 6th riot at the U.S. Capitol is an important reminder of how divided the nation remains, which could challenge the effort of national reconciliation. Some tempering of rhetoric and actions could be seen in the areas of tariffs/trade and executive orders, where the President has broader unilateral authority.
Senate
The two U.S. Senate runoff elections in Georgia on Jan. 5 were as closely-watched as any in recent years. While Republicans were expected to retain the seats, pollsters ended up with egg on their faces again, as both Democratic candidates won by narrow margins. This puts the Senate at 50-50, for only the fourth time in history. (Officially, the Democratic 50 includes two independent Senators, one of which is Bernie Sanders, who caucuses with the Democrats.) This equal split puts the deciding vote into the hands of incoming Vice President-Elect Kamala Harris, which is significant. While early descriptions of this result were as a ‘blue wave,’ many pundits have downgraded the impact to more like a ‘blue ripple’ in reality. This Democratic majority, albeit by narrower margins, could well result in further stimulus (early in 2021) and movement on infrastructure (which both parties actually agree on in principle, despite differing details—mostly in the green energy area). This could also include tightening up ACA/Obamacare, as well as procedural changes like altering the filibuster rule. Importantly, the majority gives Biden a smoother road for Senate-required approval of certain Presidential nominations. At the same time, the slim margin, and reduced Democratic majority in the House after the 2020 election, makes more extreme initiatives in health care (as in a full ‘Medicare for All’), the environment, tax law, etc. a bit more difficult to push through.
Economic Growth
The recovery in the economy continues to be almost completely dependent on the course of the pandemic and its abatement, driving estimates in both directions in recent months, along with unpredictable virus case counts. The expected -3% to -5% decline in U.S. GDP growth in 2020 is predicted to reverse to a potential mid-single digit gain in 2021 (give or take a few percent). Despite the initial trepidation about the Georgia race, the expected additional stimulus to be rolled out by a Democratic administration and Congress would be sure to have a positive effect on business and consumer spending in 2021-22, leading to even stronger GDP growth than with the late 2020 stimulus alone. (This is despite concerns of the budget deficit and high debt load down the road.) The recovery growth rate could be roughly double long-term trend growth of 2.0-2.5%, but relies on the mid-year majority vaccination timeline. With the pandemic-led recession marking the end of the last (and historically-long) business cycle, a new cycle is beginning anew. This is expected to lead to recovered corporate earnings growth in coming years—the critical long-term driver of equity returns. While some bearish observers see financial markets as looking too optimistic on 2021, based on higher price multiples, more bullish watchers see the pandemic recovery potentially more akin to the years after World War II, which benefited from a liftoff from stagnant production and pent-up consumer demand. In fact, some have gone as far as to label the coming decade a potential new ‘Roaring Twenties.’ (Interestingly, the original ‘Roaring 1920’s’ came after the 1918 influenza pandemic.)
Interest Rates
As they’ve stated directly, the Federal Reserve is committed to keeping rates low through the pandemic and for a while beyond. Some feared rates might be taken into negative territory, as in Europe, but that appears increasingly less likely due to logistical reasons, and far more pushback against it in the U.S. Long rates are also held lower by Fed purchases of treasuries and mortgages, but if inflation expectations were to rise, pressure could be felt on the long end of the yield curve first. The overall accommodative stance is likely to continue until recovery has taken hold, and until inflation picks up (over 2.0-2.5%) for a period of time. In the the first week of 2021, the 10-year treasury rose over 1.0% again as higher political odds for more stimulus (and a greater debt load) have raised the chances of higher economic growth and accompanying inflation. Overall, though, continued secular trends based on aging demographics and inconsistent productivity growth point to a consensus view that interest rates overall could stay relatively low for some time.
Financial Stability
This is an area not often discussed, due to so much focus on the short-term. What determines stability? For the most part, it’s an absence of excesses—that often include over-speculation in certain asset classes, taking on too much leverage, and higher destabilizing inflation. The 2007 housing market is a recent historical example of such an inflating and bursting bubble, but there are many historical examples. Due to well-known economist Hyman Minsky’s work in this area, the popping of such an unsustainable condition has been referred to as a ‘Minsky Moment.’ This is akin to the single snowflake that triggers a seemingly random avalanche, which is actually not random at all, but a condition that becomes increasingly likely over time as conditions build to more unstable levels. This may not be the case at the moment, being on the back end of a recession. But, over time, red flags such as exuberant sentiment without regard to any fundamentals, continued rising debt levels without regard for consequences, or the ignoring of any bad news that could derail a recovery, could all be signs of growing financial instability.
Investment Markets:
U.S. stocks. Investors have looked at the equity market with amazement, as stock prices moved almost straight back up after a -33% crash. Historically, though, such a result is not so unusual, with stocks often discounting the worst news and looking ahead toward a brighter future (even if a year or more away in reality). Valuations are a bit rich, based on expectations for 2021 revenue and earnings, with multiples appearing to look further into 2022 and even 2023 for fundamentals that justify current pricing. ‘Growth’ stocks, especially in technology and communications feature strong fundamentals, which have resulted in higher valuations, especially with today’s low interest rates. Are signs of the late 2020 rally in cyclical ‘value’ companies here to stay? Or, will a reemergence of challenges cause investors to again seek out the stability of ‘growth’? Uncertainty remains, but the coming year may offer more clues.
Antitrust issues and growth stocks. It’s been wondered whether current conditions are like the 2000 dot-com bubble, based on the extreme differential between ‘growth’ and ‘value’ sector performance. One difference, though, is that fundamentals (like profits) for today’s tech and communications companies are far more robust than at that time (in 2000, profits were often more hope than reality). In fact, high scores for the ‘quality’ factor have been a reason for the strong positive sentiment for that group. The pandemic’s challenges for smaller firms have caused even more consolidation of market share towards the biggest players. This begs the question: are these firms too dominant? There has been some increasing pressure for anti-trust legislation aimed at several mega-cap tech companies, but uncertainty about how that would look. There are some problematic legal issues. Does Congress really want to ‘punish’ the segment of the economy that has proven most resilient and efficient during the pandemic? Anti-trust typically requires a ‘damaged’ party, via price gouging or anti-competitive behavior. Do these services take unfair advantage of consumers (since they’re often free)? Do they suppress competition (or merely offer a better product)? These aren’t easily rectified.
Foreign stocks. Covid has challenged populations and businesses on a global level. While U.S. markets were seen as a safe haven in 2020 due to demand for leading technology/communications firms residing in the U.S., foreign markets offer more cyclicality, so an embedded ‘value’ bet of sorts. They also offer more relatively attractive valuations, less positive sentiment, and have been on the losing end of the U.S. vs. World equity performance trade for several years (the typical historical length for such dominance prior to a reversal). Emerging markets, in particular, have suffered high costs during the pandemic, and offer strong potential for recovery growth, due to a more modest starting point and more favorable demographics.
Bonds. An important relationship in fixed income is that total returns one should expect for coming years are mathematically tied to starting yields. This doesn’t bode well for those hoping for results like the past few decades, where rates were in a steady decline (from a peak in the early 1980’s) to today’s low levels. Credit spreads are also tighter than they were in much of 2020, with corporate improvement priced in. At the same time, while one shouldn’t necessarily expect great things from fixed income, the diversification element remains important should risk markets experience volatility. As a case in point, while interest rates were already considered low a year ago, and caution for bonds was everywhere, long-term U.S. treasuries earned 15%+ returns in 2020. Foreign bonds are an even more challenged environment, with a substantial percentage of debt offering negative yields, with price returns largely driven by currency markets.
Real estate.Last year was best described as one split between the ‘haves’ and ‘have-nots’ in the real property realm. Winners included newer niches of real estate markets that benefit from technological immersion, such as data centers and cell phone towers, and distribution centers that catered to online shopping. Valuations have risen for these assets, although fundamentals remain strong as they take a greater place in REIT indexes. Losing groups include the obvious, such as shopping malls, other retail, and travel/lodging. These represent the industries most heavily affected by lockdowns, although valuations have fallen to depressed levels, and could offer attractive sensitivity to further recovery. Office properties look to remain mixed, with some faring better than expected in the near-term, while the long-term strategic trend toward less office space/working from home has accelerated. Real estate in general has been supported by record-low financing rates, which is of course Fed-dependent.
It’s easy for investors to forget that the real estate universe is the world’s largest asset class, by overall size, and is extremely diverse.Owners of real estate assets are similarly quite diverse. On one end are residential homes and small commercial properties, which experienced contrasting results during the pandemic—strong house price increases bookended by retail locations having trouble making lease payments. So, the knee-jerk response is to cast commercial property overall in the bucket of ‘doomed’ asset. In some cases, this may be true, and has been for some time (notably in weaker strip malls in less desirable locations, and the like). However, as an institutional investment asset class, REITs generally focus their efforts on the largest, highest quality properties, in the most desirable locations (such as New York, London, etc.). While these are still sensitive to the business cycle, they’re often far less so (by design), and are far more liquid, than stand-alone properties profiled in news stories or owned in private partnerships. While there is some overlap due to similar inputs, high-quality REITs and generic Main Street real estate can provide varying results.
Commodities.Index composition varies, but energy futures contracts remain the most famous member of the asset class. Petroleum demand is more predictable in normal times, but fell off a cliff in 2020 as the pandemic put a damper on both industrial production and consumer mobility. Manufacturing has bounced back first, in China and other Asian nations, with lockdowns eased earlier. As the global economy recovers, prices for crude oil and industrial metals may also rise, as they often do when economies ‘reflate.’ Precious metals earned strong returns in 2020 due to their ‘safe haven’ tendencies, although that faded later in the year when investors sought riskier assets. A continued weaker U.S. dollar and any signs of higher inflation readings could serve to be two of the more important catalysts for commodities movement in 2021. Their most important role, however, is their lack of correlation to other asset classes in a portfolio—which can be hard to find elsewhere and often goes unappreciated.
Currencies.The U.S. dollar weakened by -7% in 2020 relative to a basket of developed market currencies, but was little changed versus emerging market currencies. As always, currency movements represent a ‘two-way street.’ This was a slight erosion in confidence in the dollar’s safe haven status, due to unprecedented amounts of fiscal and monetary stimulus, but also expectations in improved growth abroad—particularly the euro and U.K. pound as markets look past Brexit. Will this trend continue? Currency markets are fickle to say the least, but a cyclical rebound could continue to favor foreign currencies, which could translate to tailwinds for international stocks and bonds, which have lagged those of the U.S. in recent years.
These represent only a few items to watch. No doubt 2021 will bring its share of more (and hopefully positive) surprises.
Investors are routinely warned about allowing their emotions to influence their decisions. However, they are less routinely cautioned about their preconceptions and biases that may color their financial choices.
Examples of Biases
In a battle between the facts & biases, our biases may win. If we acknowledge this tendency, we may be able to avoid some unexamined choices when it comes to personal finance. It may actually “pay” to recognize blind spots and biases with investing. Here are some common examples of bias creeping into our financial lives.
1) Letting Emotions Run the Show
An investor thinks, “I got a great return from that decision,” instead of thinking, “that was a good decision because __.” (1)
How many investment decisions do we make that have a predictable outcome? Hardly any. In retrospect, it is all too easy to prize the gain from a decision over the wisdom of the decision, and to, therefore, believe that the findings with the best outcomes were the best decisions (not necessarily true). Putting some distance between your impulse to make a change and the action you want to take to help get some distance from your emotions. (1)
2) Valuing Facts We “Know” & “See” More Than “Abstract” Facts
Information that seems abstract may seem less valid or valuable than information that relates to personal experience. This is true when we consider different types of investments, the state of the markets, and the economy’s health. (2)
3) Valuing the Latest Information Most
In the investment world, the latest news is often more valuable than old news. But when the latest news is consistently good (or consistently bad), memories of previous market climate(s) may become too distant. If we are not careful, our minds may subconsciously dismiss the eventual emergence of the next bear (or bull) market. (2)
4) Being Overconfident
The more experienced we are at investing, the more confidence we have about our investment choices. When the market is going up, and a clear majority of our investment choices work out well, this reinforces our confidence, sometimes to a point where we may start to feel we can do little wrong, thanks to the state of the market, our investing acumen, or both. This can be dangerous. (3)
5) The Herd Mentality
You know how this goes: if everyone is doing something, they must be doing it for sound and logical reasons. The herd mentality is what leads many investors to buy high (and sell low). It can also promote panic selling. The advent of social media hasn’t helped with this idea. Above all, it encourages market timing, and when investors try to time the market, they frequently realize subpar returns. (4)
Sometimes, asking ourselves what our certainty is based on and reflecting about ourselves can be a helpful and informative step. Examining our preconceptions may help us as we invest.
This material was prepared by MarketingPro, Inc., and does not necessarily represent the views of the presenting party, nor their affiliates. This information has been derived from sources believed to be accurate. Please note – investing involves risk, and past performance is no guarantee of future results. The publisher is not engaged in rendering legal, accounting or other professional services. If assistance is needed, the reader is advised to engage the services of a competent professional. This information should not be construed as investment, tax or legal advice and may not be relied on for the purpose of avoiding any Federal tax penalty. This is neither a solicitation nor recommendation to purchase or sell any investment or insurance product or service, and should not be relied upon as such. All indices are unmanaged and are not illustrative of any particular investment.
It’s a new high, but not dissimilar to celebrating say, 29,999 as a new peak, although the odd number didn’t receive the same level of media attention. These round market levels, whether it be the Dow Jones Industrial Average, Nasdaq, or others, tend to generate high visibility (especially in the slower post-election news cycle). If an index is old enough, and tends to show positive performance (as stocks have over the long haul), you’ll end up reaching new and higher milestones. The seemingly-large 30,000 level is just a reflection of how long the index has been in existence. (It was first assembled in 1896 by its namesake Charles Dow, former Wall Street Journal editor, in a day where calculating the price levels of a dozen stocks by hand on paper was ‘cutting edge indexing.’) We won’t go into how the Dow is a less desirable index to track relative to others, due to its outdated price-weighted construction methodology and concentrated membership of 30 stocks, but it remains well-watched regardless due to this historical legacy. The S&P 500, more widely used by financial professionals, has gained public traction over time, but its lower and less sexy 3,000-ish level is simply a reflection of its more recent creation (early 1950’s). Total return percentages matter much more than index levels.
Fear and Greed
Most importantly, these announcements can often cause investors to react in one of two ways: (1) consider buying, after they’re reminded of their FOMO (‘fear of missing out’); or, (2) consider selling, as they see the new milestone high as feeling ‘expensive.’ Neither is an ideal approach, based on news coverage alone.
Market Realities
The new highs for several U.S. equity indexes are a reflection of the unusual year we’ve experienced. Following a dramatic (-33%) drawdown in March, stocks have recovered—and then some (+65%). The rebound triggers opposing investor emotions largely because of what this extreme movement represents, in realities on the ground as well as anticipated future realities. While fundamentals (revenues and earnings) have improved as lockdowns eased mid-year, we’re now in the throes of a second wave which could dampen the recovery outlook again. Yet, promising vaccine data gives markets more of what they really want, which is the removal of uncertainty about an ending point for the pandemic. If sometime in 2021 provides virus containment and herd immunity, today’s multiples are expected to ‘grow into’ 2021 and 2022 earnings expectations. The damage from the lockdowns earlier this year were such that higher-than-average recovery growth, at the current path, could be the case for several quarters, if not a few years. The Fed also looks to remain on hold during that time. As important as anything, low interest rates tend to be an extremely powerful and positive input into fair values for stocks and real estate
Smart Investing
With the end of the year approaching, it’s likely a good time to reevaluate portfolio positioning. Reacting to recent equity strength by a knee-jerk extreme of going ‘all in,’ or ‘getting out’ completely can be disruptive, especially since the second question of ‘now what?’ offers few alternative. Rather, if one’s risk allocation level needs to be adjusted, doing so by a notch or two can provide continued market exposure, yet not cause one to completely miss out on potential market gains over time (or even sharp movements from the ‘best days’). Stock market timing is extremely difficult, if not impossible. Therefore, any move that changes exposure to that growth engine, relative to the stabilizing force of bonds in portfolio creates risk-return trade-offs. ‘Regret’ is a real force discussed many times by economists involved in behavioral finance.
During periods of extreme market declines, a natural emotional reaction can be to sell out of the market and seek safety in cash. The results of this reaction can be devastating because often the best days occur close to the worst days during periods of market volatility. This chart compares an individual who was fully invested for the past 20 years in the S&P 500 to investors who missed some of the best days as a result of being out of the market for a period of time. Missing the top 10 best days will halve the annualized return; missing the top 30 days will result in a negative annualized return on the original $10,000 investment. Rather than emotionally reacting to or trying to time the market, adopting a disciplined long-term investment strategy may produce a better retirement outcome.
1) Markets have tended to predict election results
A simple stock market metric has correctly predicted the winner in 20 of the last 23 presidential elections since 1936 — a track record that might make even the top pollsters jealous. If the S&P 500 Index is up in the three months prior to Election Day, the incumbent party usually wins. If markets are down during that period, the opposing party typically claims victory.
Why is this? It’s because equities tend to look ahead and “price in” uncertainty — including that caused by an upcoming election.
When the stock market and the economy are strong, there is usually less motivation for a change in leadership. In those years, stocks may not need to discount the uncertainty, which often allows stocks to continue rising, further bolstering the incumbent’s chance of reelection.
When the political and economic climate are more challenging, there is a greater chance that the opposing party will win. The market discounts the added uncertainty of the election outcome and what policy changes may occur, which can lead to higher volatility.
What does this mean for 2020? As of September 15, the S&P 500 is up 3% since August 3rd (three months prior to Election Day) and 5% year-to-date. In more normal times that would favor the incumbent, but today’s shaky economy offers a different story. Since 1912, only once has a president been reelected if he oversaw a recession within two years of the election. While this trend may be interesting, investors shouldn’t use it as an excuse to try to time markets. Historically, whether the incumbent wins or loses, election volatility has usually been short-lived and quickly given way to upward moving markets.
2) Gridlock or sweep? Equities have gone up either way
One of the biggest concerns investors have this election cycle is the possibility of a Democratic sweep of the White House and Congress. Many assume this so-called “blue wave” will lead to a reversal of policies like deregulation or the Tax Cuts and Jobs Act of 2017. While it’s true that a new party typically brings its own policy agenda, assuming such an outcome will lead to meaningfully lower stock prices is probably over-simplifying the complexities of stock markets.
History shows that stocks have done well regardless of the makeup of Washington. Since 1933, there have been 42 years where one party has controlled the White House and both chambers of Congress at the same time. During such periods, stocks have averaged double-digit returns. This is nearly identical to the average gains in years when Congress was split between the two parties. Historically the “least good” outcome has been when Congress is controlled by the opposite party of the president. But even this scenario notched a solid 7.4% average return.
What does this mean for 2020? This year’s election will almost certainly end in either a unified government under a blue wave or a split Congress, which could happen with either a Trump or Biden victory. Voters may have a strong preference, but investors should take comfort that both scenarios have historically produced strong equity returns.
3) Markets have trended higher regardless of which party wins the election
Politics can bring out strong emotions and biases, but investors would be wise to tune out the noise and focus on the long term. That’s because elections have, historically speaking, made essentially no difference when it comes to long-term investment returns.
Which party is in power hasn’t made a meaningful difference to stocks either. Over the last 85 years, there have been seven Democratic and seven Republican presidents, and the general direction of the market has always been up. What should matter more to investors than election results is staying invested.
What does this mean for 2020? Some have called the 2020 election the most important in our lifetime. But that has been said about previous elections and will be said again about future elections. This year has been unique in countless ways, but a look at past election cycles shows that controversy and uncertainty have surrounded many campaigns. And in each case the market continued to be resilient. By maintaining a long-term focus, investors can position themselves for a brighter future regardless of the outcome on Election Day.
4) Investors often become more conservative in election years
It can be tough to avoid the negative messaging around election coverage. And it’s natural to allow the rhetoric of political campaigns to make us emotional. History has shown that elections have had a clear impact on investor behavior, but it’s important that investors don’t allow pessimism to steer them away from their long-term investment plan.
Investors have poured assets into money market funds — traditionally one of the lowest risk investment vehicles — to a much greater degree in election years. By contrast, equity funds have seen the highest net inflows in the year immediately following an election.
This suggests that investors want to minimize risk during election years and wait until any uncertainty has subsided to revisit riskier assets like stocks. But market timing is rarely a winning investment strategy, and it can pose a major problem for portfolio returns.
What does this mean for 2020? This trend accelerated in 2020: Through July 31, net money market flows increased $546 billion while net equity fund flows decreased $36 billion. Of course, part of this year’s flight to safety was related to the pandemic-induced recession and not the election. Still, equity funds saw their largest monthly outflows in July, indicating that investors are remaining conservative ahead of the election.
5) Moving to cash in election years can reduce long-term portfolio returns
What has been the best way to invest in election years? It isn’t by sitting on the sidelines.
To verify this, we looked at three hypothetical investors, each with a different investment approach. We then calculated the ending value of each of their portfolios over the last 22 election cycles, assuming a four-year holding period.
The investor who stayed on the sidelines had the worst outcome 16 times and only had the best outcome three times. Meanwhile, investors that were fully invested or made monthly contributions during election years came out on top. These investors had higher average portfolio balances over the full period and more frequently outpaced the investor who stayed in cash longer. These results reflect four-year holding periods, but the divergence would be even wider if compounded over longer time frames.
Sticking with a sound long-term investment plan based on individual investment objectives is usually the best course of action. Whether that strategy is to be fully invested throughout the year or to consistently invest through a vehicle such as a 401(k) plan, the bottom line is that investors should avoid market timing around politics. As is often the case with investing, the key is to put aside short-term noise and focus on long-term goals.
What does this mean for 2020? It’s too early to know what the impact of this year’s flight to cash will be on investors’ long-term portfolio returns. But with the S&P 500 soaring over 50% since the March bottom and net equity selling continuing throughout the year, it is safe to assume many investors missed at least some of this powerful equity rally and remain on the sidelines ahead of the November election.
Investments are not FDIC-insured, nor are they deposits of or guaranteed by a bank or any other entity, so they may lose value.
Investors should carefully consider investment objectives, risks, charges and expenses. This and other important information is contained in the fund prospectuses and summary prospectuses, which can be obtained from a financial professional and should be read carefully before investing.
Statements attributed to an individual represent the opinions of that individual as of the date published and do not necessarily reflect the opinions of Capital Group or its affiliates. This information is intended to highlight issues and should not be considered advice, an endorsement or a recommendation.
All Capital Group trademarks mentioned are owned by The Capital Group Companies, Inc., an affiliated company or fund. All other company and product names mentioned are the property of their respective companies.
American Funds Distributors, Inc., member FINRA.
This content, developed by Capital Group, home of American Funds, should not be used as a primary basis for investment decisions and is not intended to serve as impartial investment or fiduciary advice.
Indexes are unmanaged and, therefore, have no expenses. Investors cannot invest directly in an index.
Book a FREE 15 minute, no commitment, phone call with me to discuss your financial situation and see if I can help. Pick a date & time that works for you!
visit weiss-financial.com to learn about our retirement planning & investment services.
Blog Topics:
What I’m Reading
Disclosure
Weiss Financial Group is a registered investment advisor. Information presented is for educational purposes only and does not intend to make an offer or solicitation for the sale or purchase of any specific securities product, service, or investment strategy. Investments involve risk and unless otherwise stated, are not guaranteed. Be sure to first consult with a qualified financial adviser, tax professional, or attorney before implementing any strategy or recommendation discussed herein. Insurance products and services are offered through individually licensed and appointed agents in all applicable jurisdictions. The advisers at Weiss Financial Group are not attorneys of a law firm but can provide guidance to the client’s other professionals.